In Part Two, I will take a closer look at Poolbeg and Dublin Bay CCGT over the same period as Part 1 - 1st November to 4th November, 2014. In Figure 1, these are the green and blue lines along the
bottom :
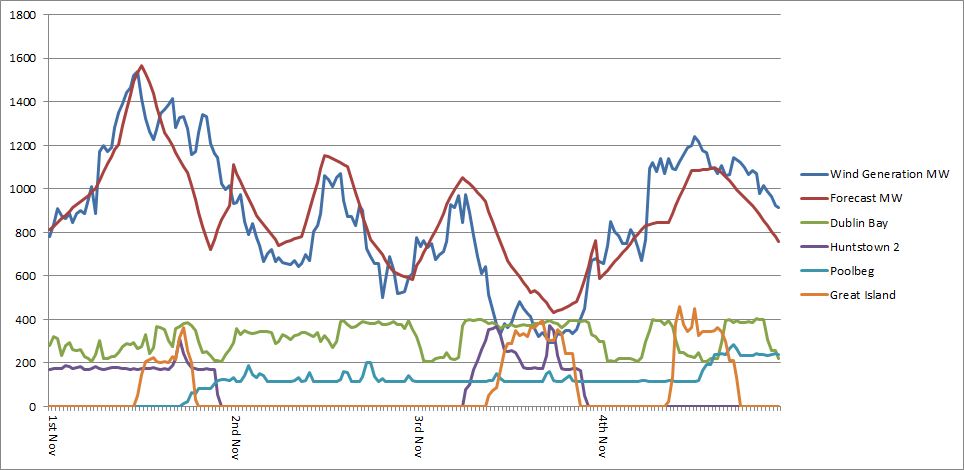 |
| Figure 1: Total Wind Generation and Forecast for the Republic (Eirgrid) and Profiles of Dublin Generators (SEMO) 1st Nov - 4th Nov, 2014 |
Before I proceed, a little explanation on the operation of CCGT (combined cycle gas turbine) is required. This type of plant is the most efficient for converting gas into electricity. It is basically a gas turbine, such as what is in an airplane. But unlike the gas generators of old where the steam is released into the sky through a stack, the CCGT converts the steam into electricity aswell. We can see from the following graph what the efficiency is like at various output / loads:
 |
| From http://www.thermalplant.com |
So for
instance, a plant on full load producing 400 MW, a typical Irish
CCGT, will have an efficiency of about 58%, but when throttled back
to 200 MW, the efficiency has dropped to 50%. While the curve is not
continued below 50% loading on the plant, it is in fact a steeply
dropping curve, such that at 100 MW (33% load), the efficiency is
less than 40%.
In other words when
running a CCGT at 33% load you need to burn 2.5 MW of gas to generate
1 MW of electricity. If you ramp back up the power station to 100%
load, you only need to burn 1.7 MW of gas to produce the same 1 MW of
electricity. This means effectively that by operating the CCGT at one
third of its design load, the unit gas consumption has gone up by
50%.
The same can be seen in
the carbon dioxide emissions in Figure 2. When the CCGT power plant is
operating at full throttle, the carbon dioxide emissions are as low
as 0.35 tonnes per MWh (350 g/kWh), but start to rise rapidly as the
output of the plant is reduced.
 |
| From http://www.thermalplant.com |
So bearing this in mind, we now come to Dublin Bay and Poolbeg.

Dublin Bay is a 415MW gas plant. Figure 2 compares the load profiles for Dublin Bay for a period with no wind in October (9th to the 12th), and the above high wind period in November.

Dublin Bay CCGT
.png) |
| Figure 2: Dublin Bay operating at different loads |
We can see that it was operating at close to full load, producing around 390MW (95% load), during the period in October. According to a recent EPA report, Dublin Bay has an efficiency of 56.97%. So to produce about 390MW of electricity, 680MW of gas was consumed. In November, when high winds moved across the country, we can see that there was alot more cycling, particularly in the first two days. When it ran at 50% load in November, its efficiency was about 50% or slightly below. So to produce 200MW, roughly 400MW of gas was consumed. So there was a fossil fuel saving in the region of 280MW when operating at 50% load as opposed to 95% load, but there was also a corresponding rise in emissions of circa 0.05 tonnes per MWh. These savings don't take into account any increase in reserve that may have occurred during the period of high winds. This information is unavailable unfortunately.
Engineers in the trade are now realizing that this increased cycling is not something that is without consequence. Gas power plants evolved over the years from pretty lousy efficiency to a very high degree of efficiency in modern times due to the great ingenuity of engineers. These advances are now been undone by the high levels of wind energy been allowed into grids across Europe and elsewhere. As posted in a previous blog , German engineers are now claiming:
"that existing plants are not technically laid out for the operational requirements of today, which naturally is being altered due to the highly intermittent input of increasing amounts of solar and wind energy on to the grid. This rapid increase in renewables in recent years in Germany has put operational demands on existing gas and coal power plants, which are simply not technically designed for it. The plants must be more frequently switched on and off in order to be able to compensate for the fluctuations, which are associated with electrical inputs from sun, wind and water. The degree of load change is partly more than 200 times higher than that permissible for the power station. As a result the danger of lasting damage to the power plants grows – along with increasing risks to the security of electrical supply."
So who will pick up the tab for the increased maintenance of these generators that will result ? Well, ESB, a semi state company, owns Dublin Bay, so the answer is the Irish taxpayer. The Irish people part own a very expensive asset in Dublin Bay, one of the most efficient plants in the country at generating electricity, now been run increasingly like its inefficient ancestors of old. It's akin to buying a brand new car and driving it in second gear on a motorway. So there is a trade off between the fossil fuel savings from wind and the inefficient operating of plant. Of course, if wind could replace the plant in its entirety, then the problem would be solved.
Poolbeg CCGT
Poolbeg is a 463MW gas plant also operated by ESB. However, it is not a modern CCGT like Dublin Bay, but rather an older model. Therefore it has a lower efficiency - 46% according to EPA. Figure 3 shows the different load profiles during the period of high winds in November and the same period above in October with low winds :
During the period in November, Poolbeg was ramped down to 25% to allow the high wind penetration into the system. Its normal position is seen in the blue line during the period in October, where it sits at circa 50% and ramps up when there is additional demand. Because demand has fallen in recent years, there is no longer a need for all the extra capacity in the Dublin region and so Poolbeg (which has to run to maintain voltage) runs on half load most of the time. (by the way, average Demand over the two periods in this study is almost identical). So during the low wind period, the efficiency of the plant is circa 42% based on an average load factor of 58%. This results in average fuel consumption of 550MW to generate 230MW of electricity. But during the period of high wind, with a load factor of 25%, the efficiency of the plant has now fallen off a cliff, exacerbated by the fact that Poolbeg is not an efficient modern CCGT plant to begin with. So the efficiency in this case is circa 20%, meaning that fuel consumption is in the order of 574MW to generate 115MW of electricity. So the plant actually consumed more fuel when the high winds moved over the country - See Figure 4.
.png) |
| Figure 3: Poolbeg CCGT different load profiles |
During the period in November, Poolbeg was ramped down to 25% to allow the high wind penetration into the system. Its normal position is seen in the blue line during the period in October, where it sits at circa 50% and ramps up when there is additional demand. Because demand has fallen in recent years, there is no longer a need for all the extra capacity in the Dublin region and so Poolbeg (which has to run to maintain voltage) runs on half load most of the time. (by the way, average Demand over the two periods in this study is almost identical). So during the low wind period, the efficiency of the plant is circa 42% based on an average load factor of 58%. This results in average fuel consumption of 550MW to generate 230MW of electricity. But during the period of high wind, with a load factor of 25%, the efficiency of the plant has now fallen off a cliff, exacerbated by the fact that Poolbeg is not an efficient modern CCGT plant to begin with. So the efficiency in this case is circa 20%, meaning that fuel consumption is in the order of 574MW to generate 115MW of electricity. So the plant actually consumed more fuel when the high winds moved over the country - See Figure 4.
.png) |
| Figure 4 : Poolbeg CCGT fuel consumption - ramping down to low loads can lead to increased fuel consumption and CO2 emissions
Likewise, the CO2 emissions were greater during the high wind period which brings up the issue as to whether the EPA should be monitoring and doing something about situations like the above.
So it can be shown that very high winds can lead to an increase in emissions and fuel consumption - the very opposite of what was intended - what is known as "the law of unintended consequences".
While there was a fuel saving in Dublin Bay (when one discounts the emissions involved in the installation and manufacture of wind turbines), there was fuel and emissions cost in Poolbeg.
There is also potential maintenance problems that may result for both plants - with ESB and the taxpayer / consumer picking up the tab.
This is another problem that will be exacerbated when more wind is added to the system. As already pointed out, two of the large gas power plants in Dublin have to run at all times and can't be shutdown regardless of how much wind energy is generated. So these plants will be forced to increasingly ramp down to even further lower loads, further increasing fuel consumption and emissions. This proves that wind energy is only of any use at low penetration levels unless there is large levels of hydro in the system such as in Scandanavia (and even there, they have to export a large proportion of their wind output).
|
Wind is not there 75% of the time, its not reliable when it is there. It cannot be used for base load, it can only be allowed in at below 50% of total. It gets a guaranteed price of 70 euors whereas the rest gets 57 euros. It gets capacity payments based on its potential to generate 27/7 every hour of every day and it needs thermal plant to match every new wind farm build in equal proportions. Is it any wonder our bills are rising?
ReplyDelete